Zeebe Low Performance

We ran round of test on
zeebe broker 0.23.3

All with following configuration

  • 5 nodes and 16 partitions, 4 cpu thread count and 1 io thread count
  • resources:
    *limits:
    *cpu: “5”
    *memory: 12Gi
    *cpu: “5”
    *memory: 12Gi
    *8v CPU and 32GB RAM all broker

Scenario 1
request = 30 req/sec
request fired = 9274
request processed = 9274(Camunda operate)
dropped =0 (in grafana)
No drop No delay

Scenario 2
request = 1000 req/sec
request fired = 300363
request processed = Operate crashed! (Camunda operate)
dropped =
Operate crashed!
request seen in grafana = 996000
dropped = 499000

Since operate crashed next all load runs have data captured from grafana.

What we noticed was grafana values are not in sync with the total request fired from the Gatling side but operate has the exact values at least the number of instances running / completed

But still for reference we are adding all our observations

Scenario 3
request = 250 req / sec
request fired = 75059
request seen in grafana = 234200
dropped = 15760

Scenario 4
request = 150 req / sec
request fired = 45025
request seen in grafana = 14330
dropped = 7980

Scenario 5
request = 80 req / sec
request fired = 23999
request seen in grafana = 73700
dropped = 1779

Scenario 6
request = 70 req / sec
request fired = 20978
request seen in grafana = 70000
dropped = 874

Scenario 7
request = 40 req / sec
request fired = 12102
request seen in grafana = 43900
dropped = 55

We have added all the observations here. Since we are new to zeebe we want some pointers.

Target
Target which we want to hit is 1000 req / sec (1000 instance created and processed per second) with 1 worker, 8 threads with no dropped request and all instances should be created and completed with no delay.

Since we are not adding any delay in job worker we wanted to hit this target.

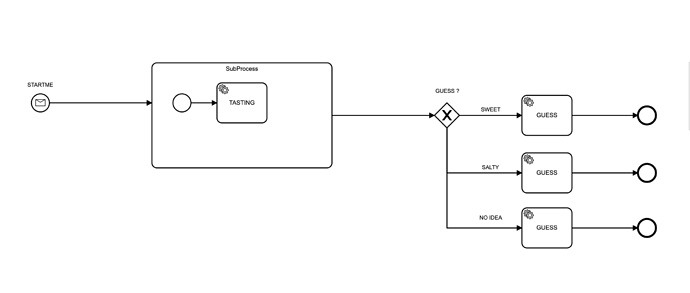
Basic workflow which we are running for benchmark results

Hey @arpitagarwal78,
any success on getting target performance?

I’m also very concerned regarding the performance.
Cannot achieve more than 40 starts/sec on 1 broker/4 partitions/4 cpu threads+ 2 io threads.

Hey @jetdream

the exporter and processing are decoupled so I would say given enough resources it should not impact that much. If you have not enough resources like cpu etc. then of course they will compete with each other. I have no prove for that, but we always test with elasticsearch exporter.

You can expect that the broker will delete faster this is an assumption which is safe to take.

Greets
Chris

Hey @arpitagarwal78

sorry for the late response I was on vacation.

After you change the configuration to 5 nodes you mentioned dealine exceeded. How often do you see this? Do you use then a standalone gateway?

It would help to understand the setup better if you always share your complete configuration, e.g. the values file, the helm version etc.

I revisited the previous posts and saw that you mentioned you are starting workflow instances via messages is this still the case? Are you using always the same correlationKey? If you use always the same correlationKey then it will be published on the same partition.

The job workers have 8 threads, but only 32 max jobs activate is this the case? Maybe you can increase the number as well.

In you scenario descriptions what do you mean with “request processed = 20454 (Camunda operate)*”
You see that many instances in operate?

What we noticed was grafana values are not in sync with the total request fired from the Gatling side but operate has the exact values at least the number of instances running / completed

I’m not sure what you mean with this. Do you have an screenshot of the corresponding panel you mean?

Not for now.

Hey @jetdream

how does you deployment look like? Is it local? Do you use a ssd ?

Greets
Chris

Hey @Zelldon
I got your answer regarding exporters impact, thanks,

As of performance I use local development environment on the pretty good hardware:

  • CPU i5 9Gen (4 core + 4 hyper-threading)
  • 40Gb RAM
  • NVMe SSD

Last test: Zeebe + Standalone gateway + default config files

  - ZEEBE_PARTITIONS_COUNT=2
  - ZEEBE_CLUSTER_SIZE=1
  - ZEEBE_REPLICATION_FACTOR=1
  - ZEEBE_BROKER_THREADS_CPUTHREADCOUNT=4
  - ZEEBE_BROKER_THREADS_IOTHREADCOUNT=2

I’m starting instances from Nodejs app, limiting parallel starts by partitionsCount

const parallelFactor = this.topology.partitionsCount;
await Parallel.each(instancesVariables, async (instanceVariables) => {
    await this.zbc.createWorkflowInstance(processDefinitionId, instanceVariables);
}, parallelFactor);

During the tests I got CPU load almost 100% (nodejs is almost idle)
Played with different numbers of brokers (from 1 to 3), partitions (from 1 to 6), CPU and IO threads. No significant difference in terms of starts/sec. Tried to turn off all the exporters.
Tried to increase parallel factor up to 2*partitionsCount, did not get significantly more performance but started to see RESOURCE_EXHAUSTED messages.

As a test process were using the two kinds of simple processes:

  1. start → stop
  2. start → timer (1 day) → stop

Never got more than 45 starts/sec.

Looking on benchmarks I feel like I’m using completely another product.
Being everything local I can’t understand why it is so slow.

I’d really appreciate any hints on how to improve the performance.

Hey @jetdream

how do you want to deploy it in the end? I would suggest to deploy it the same way as you want to use it later, because if you find now a good configuration it doesn’t mean that this will work in the same way as on the end deployment.

What I mean is that you currently have a standalone gateway and a broker, for local deployment this makes for me no sense. I would go then with the embedded gateway. But if you deploy it in kubernetes or something else then I would probably suggest to use a standalone gateway which can be scaled independently. The standalone gateway has per default only one thread, which might be the bottle neck here, so either increase the thread count or use the embedded gateway, which shares the threads with the broker.

You currently run the client, gateway and broker on one machine. I would suspect and hope that this will not be the end deployment, because currently all of these applications compete for resources.

Greets
Chris

P.S.: Be aware that this blog post is 2 years old. We haven’t focused on performance since then.

Hi @Zelldon

Hope you are doing good.

Looks like I have posted a lot of messages thus things are getting messed up, Sorry for that.

So after changing configuration to 5 nodes and increasing management thread to 5 we were unable to connect to our zeebe broker but then when we reverted the management thread to 1 it was all fine.

You can refer to the comments above where I have listed all the Scenarios which we have uncovered with our load.

To be specific see

  1. Zeebe Low Performance (Configuration Type 1)
  2. Zeebe Low Performance (Configuration Type 2)

All the configuration details are within the comment section.

Question 1

After you change the configuration to 5 nodes you mentioned dealine exceeded. How often do you see this? Do you use then a standalone gateway?

Yes till when we changed the management thread to 1 it was always there.
We are using standalone gateway with 3 replicas.

Question 2

It would help to understand the setup better if you always share your complete configuration, e.g. the values file, the helm version etc.

zeebe-cluster:
    clusterSize: "5"
    partitionCount: "16"
    replicationFactor: "3"
    cpuThreadCount: "4"
    ioThreadCount: "4"

    global:
        logLevel: debug
    gateway:
        replicas: 3
        logLevel: debug
    prometheus:
        servicemonitor:
            enabled: true

    # tolerations:
    tolerations:
    - effect: NoExecute
      key: role
      operator: Equal
      value: zeebe
    affinity:
      nodeAffinity:
        requiredDuringSchedulingIgnoredDuringExecution:
          nodeSelectorTerms:
            - matchExpressions:
                - key: role
                  operator: In
                  values: 
                    - zeebe
    
   
    # JavaOpts:
    # DEFAULTS

    JavaOpts: |
        -XX:+UseParallelGC 
        -XX:MinHeapFreeRatio=5
        -XX:MaxHeapFreeRatio=10
        -XX:MaxRAMPercentage=25.0 
        -XX:GCTimeRatio=4 
        -XX:AdaptiveSizePolicyWeight=90
        -XX:+PrintFlagsFinal
        -Xmx4g
        -Xms4g
        -XX:+HeapDumpOnOutOfMemoryError
        -XX:HeapDumpPath=/usr/local/zeebe/data
        -XX:ErrorFile=/usr/local/zeebe/data/zeebe_error%p.log
    # RESOURCES

    resources:
        limits:
            cpu: 5
            memory: 12Gi
        requests:
            cpu: 5
            memory: 12Gi

    # PVC

    pvcAccessMode: ["ReadWriteOnce"]
    pvcSize: 128Gi

    # ELASTIC

    elasticsearch:
        replicas: 3
        minimumMasterNodes: 2
        service:
          transportPortName: tcp-transport

        volumeClaimTemplate:
            accessModes: [ "ReadWriteOnce" ]
            resources:
                requests:
                    storage: 100Gi

        esJavaOpts: "-Xmx4g -Xms4g"
        # tolerations:
        tolerations:
        - effect: NoExecute
          key: role
          operator: Equal
          value: elasticsearch
  
        resources:
            requests:
                cpu: 3
                memory: 8Gi
            limits:
                cpu: 3
                memory: 8Gi

Question 3

I revisited the previous posts and saw that you mentioned you are starting workflow instances via messages is this still the case? Are you using always the same correlationKey ? If you use always the same correlationKey then it will be published on the same partition.

Yes we are using message start event to start our workflow
correlationKey is unique for a particular instance been started (that is our use case and we can’t devoid)
As I said correlationKey is unique for a particular instance and correlationKey is different for different instance.

Question 4

The job workers have 8 threads, but only 32 max jobs activate is this the case? Maybe you can increase the number as well.

The above configuration was default but we updated the configuration on the worker side as

  @ZeebeWorker(`type` = "tasting", name = "tasting", maxJobsActive = 200)

with maxJobsActive as 200

Question 5

In you scenario descriptions what do you mean with “request processed = 20454 (Camunda operate)*
You see that many instances in operate?

Grafana provides a graph for metrics result for total_number_of_requests been fired in Zeebe.
Ideally these request should be equal to the number of instance creation request I am sending from service but when we verified that the number was vague in a way it gives us more number of requests than actually fired.
Thus as a fallback we verified total number of instances completed on Operate which was genuine and we have noted down instances completed from the Operate data itself not the grafana metrics.

Bottom Line
We wanted to achieve a result of 1000 instance created / completed per seconds. Please let us know whatever configuration is required to achieve this number. We can even share you with the benchmark results but if someone can actively support us then we would really appreciate that since we have limited time now.
1 Like

@arpitagarwal78 sorry again for the late response.

So after changing configuration to 5 nodes and increasing management thread to 5 we were unable to connect to our zeebe broker but then when we reverted the management thread to 1 it was all fine.

This sounds like an bug. Is this reproducible?

Regarding to your configuration I have some comments:

    clusterSize: "5"
    partitionCount: "16"
    replicationFactor: "3"
    cpuThreadCount: "4"
    ioThreadCount: "4"

This means you have the following partition distribution

[zell scripts/ ns:zeebe-chaos]$ ./partitionDistribution.sh 5 16 3
Distribution:
P\N|	N 0|	N 1|	N 2|	N 3|	N 4
P 0|	L  |	F  |	F  |	-  |	-  
P 1|	-  |	L  |	F  |	F  |	-  
P 2|	-  |	-  |	L  |	F  |	F  
P 3|	F  |	-  |	-  |	L  |	F  
P 4|	F  |	F  |	-  |	-  |	L  
P 5|	L  |	F  |	F  |	-  |	-  
P 6|	-  |	L  |	F  |	F  |	-  
P 7|	-  |	-  |	L  |	F  |	F  
P 8|	F  |	-  |	-  |	L  |	F  
P 9|	F  |	F  |	-  |	-  |	L  
P 10|	L  |	F  |	F  |	-  |	-  
P 11|	-  |	L  |	F  |	F  |	-  
P 12|	-  |	-  |	L  |	F  |	F  
P 13|	F  |	-  |	-  |	L  |	F  
P 14|	F  |	F  |	-  |	-  |	L  
P 15|	L  |	F  |	F  |	-  |	-  

Partitions per Node:
N 0: 10
N 1: 10
N 2: 10
N 3: 9
N 4: 9

I think the thread count is to small for this, also the resource limits. Do you checked the metrics in grafana? How does the resource consumption look like?

    JavaOpts: |
        -XX:+UseParallelGC 
        -XX:MinHeapFreeRatio=5
        -XX:MaxHeapFreeRatio=10
        -XX:MaxRAMPercentage=25.0 
        -XX:GCTimeRatio=4 
        -XX:AdaptiveSizePolicyWeight=90

Please remove these options. We found some problems due to these configurations, see this issue https://github.com/zeebe-io/zeebe/issues/4664


    pvcAccessMode: ["ReadWriteOnce"]
    pvcSize: 128Gi

You haven’t set any pvcStorageClass, is this intended? What is your default storageClass? I encourage you to use a fast disk (ssd). As far as I know per default hard disk’s are used.

Yes we are using message start event to start our workflow
correlationKey is unique for a particular instance been started (that is our use case and we can’t devoid)
As I said correlationKey is unique for a particular instance and correlationKey is different for different instance.

Ok thanks.

Thus as a fallback we verified total number of instances completed on Operate which was genuine and we have noted down instances completed from the Operate data itself not the grafana metrics.

Just to make it clear Operate views exported records, there is a certain delay until it ends and is shown in operate. We have metrics available in the grafana dashboard, which you can use to verify how many workflow instances have been completed. I would suggest to use the metrics instead.

We can even share you with the benchmark results but if someone can actively support us then we would really appreciate that since we have limited time now.

Maybe @jwulf can help you with getting the right contacts, such that we can support you better. Maybe we can offer some consultant hours.

Greets
Chris

@Zelldon thanks alot!

@jwulf Please can you provide with the contacts as @Zelldon mentioned :slight_smile:

@Zelldon

Hi again!

Was curious to know How is partition related to worker and the broker

Will it make sense to say more the partition better the performance ?

Please can you give more insides on the same ?