I have done a lot of tests in the way of compiling zeebe source code on my mac. Not just create an instance, but run the entire instance.
I sincerely hope that the team can perform stress tests on independent Standalone Broker (with embedded gateway) under mac or linux systems.
I hope to use Zeebe to complete 1000 instances per second without using too many machines.
I understand that Standalone Broker (with embedded gateway) is unlikely to meet this requirement, but even 20 process instances per second cannot be completed.
’RESOURCE_EXHAUSTED: Reached maximum capacity of requests handled’
Admittedly, with a better machine configuration and increased brokers, performance may improve. But for companies, the cost is very high. I just think that as a framework, the performance will not be like this, whether there is more room for optimization.
Through various channels, I met people from other companies who are also researching and using zeebe. But they are more of a wait-and-see attitude, because of performance issues, they are not intended to be used in a production environment.
Above, I just hope that the team can pay attention to the performance problems we encountered.
@wenminglei the team is actively working on these issues. Can you make sure that you create GitHub issues for each of the issues that you encountered? It will be great if you share with us how you were testing to make sure that it is not a configuration problem.
You mention “RESOURCE_EXHAUSTED” which basically means that the backoff mechanism is kicking off, it might be just matter of configuring it correctly so it doesn’t kick in that fast. @deepthi might help us ith that.
Hi,@salaboy,thank you for your reply.
I have done some research on zeebe and determined that it is not the configuration problem that caused the problem. I tried to turn off the back pressure mechanism. Although the exception mentioned above will not be reported again, but if I don’t enable backpressure, start 50 threads to create instances concurrently (or start more threads), the completion time of an instance can take up to 7 seconds (this is uncertain Time, sometimes even longer).At the same time, the performance is only to 180 instances per second.
’Partition-1 receiving too many requests. Current limit 20 inflight 28, dropping request 882 from gateway‘
The above is my contradiction:
If I want the instance to be completed quickly. I need to turn on the back pressure to ensure that the number of requests processed by the broker does not reach the limit.
If I want better performance, I need to turn off the back pressure. My extensive experiments show that even with the back pressure turned off, the performance of the three-node broker is not very good.
Therefore, I sincerely hope that the team can produce a stress test report to confirm that these are real problems.
@wenminglei is it possible for your to share your extensive experiments? So we can compare with our internal results. We are actually working hard to expose the numbers that the internal teams are getting to keep improving from there.
Cheers
I am not quite sure how to express my stress test to you. As I described above, I deployed Standalone Broker (with embedded gateway) with a single node on Linux. The number of partitions is set to 10. The machine parameters are:
vCPUs Platform Memory (GiB)
12 64-bit 125
My process:
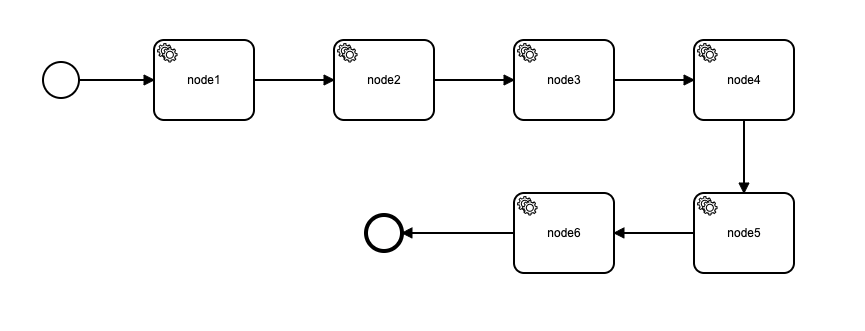
I used jmeter for stress testing, started a fixed number of threads to create instances, and at the same time, my application was also processing jobs.
@ZeebeWorker(type = "node1")
    public void node1(final JobClient client, ActivatedJob job){
        client.newCompleteCommand(job.getKey()).send();
    }

    @ZeebeWorker(type = "node2")
    public void node2(final JobClient client, ActivatedJob job){
        client.newCompleteCommand(job.getKey()).send();
    }

    @ZeebeWorker(type = "node3")
    public void node3(final JobClient client, ActivatedJob job){
        client.newCompleteCommand(job.getKey()).send();
    }

    @ZeebeWorker(type = "node4")
    public void node4(final JobClient client, ActivatedJob job){
        client.newCompleteCommand(job.getKey()).send();
    }

    @ZeebeWorker(type = "node5")
    public void node5(final JobClient client, final ActivatedJob job){
        client.newCompleteCommand(job.getKey()).send();
    }

    @ZeebeWorker(type = "node6")
    public void node6(final JobClient client, final ActivatedJob job){
        client.newCompleteCommand(job.getKey()).send();
    }
Then, I observe the monitoring situation. View the number of completed instances per second, the average time it takes to complete the instance, the time spent on each gRPC, etc.
Because I encountered errors mentioned above after increasing the number of threads that created the instance, I did not come up with an exact figure. In short, the main problem is that with such a performance machine, the number of completed instances per second is too small, and the average time to complete the instance is too long. This is a huge performance gap compared to the rabbitmq I currently use. I’m just stating the facts, without any offense. For systems with tps over 1000, Zeebe is more like a toy. There is no way to replace the rabbitMq we currently use.
I just think that zeebe is somehow similar to mq middleware。The investment in performance optimization should be much greater than the supported elements or others.
@wenminglei I think that comparing and having the same expectation between Zeebe and RabbitMQ is a wrong start.
- RabbitMQ is a mature project(2007) with all that entails, they have been improving performance over 13 years. Having the same expectations for a much younger project doesn’t make too much sense to me.
- Zeebe is not a message broker, you are comparing a message broker which it’s only purpose is to forward messages to Zeebe, which provides workflow model executions. Zeebe is designed to integrate with message brokers, and depending on the logic latency will be introduced.
- In the following months, no date defined yet, we will be publish some base line metrics, which will include more detailed setup and their performance baselines. We believe that it is quite important to keep the numbers transparent and avoid pushing users to do these performance testings.
I’ve notice that you just started a single broker, which basically means that you have a single process with a bunch of threads, that might not be optimal to measure performance.