RESOURCE_EXHAUSTED: Reached maximum capacity of requests handled

Excellent responses @jwulf. Lots of good information all in one place. We have always gone on the assumption that BPMN processing is not free but good to have an approximate number.

Some additional notes.

While thinking about performance, you may also want to note that clustering Zeebe is mostly about achieving fault tolerance and throughput in terms of how many workflow instances you complete in a certain amount of time. The number of workflow instances which can be started is not really a realistic and good measure of performance as creating and starting workflow instances only for them to fail or not complete is not useful. Clustering comes with the overhead of managing nodes, partitioning and replication which takes away CPU cycles from actually executing workflow instances. In other words, it is not free which is why you should not expect an increase of x times the number of workflow instances completed if you increase your broker count by x. Expect less than x and be happy with that :slight_smile:

In terms of raw performance on how fast workflow instances complete, this will depend on several factors including broker load. But I would say if you assume a worse case scenario on broker load to deal with the additional overhead of clustering, partitioning, replication, etc, overall workflow complexity and executing time for each of the jobs being executed by a worker will carry a greater weight in this equation. However, having a fast machine allows things to get done quicker.

I like equations here are some guidelines we use:

broker load = function (number of partitions + replications). If you anticipate creating lots of workflow instances to be started (the burst scenario) and are not overly worried about how fast workflow instances complete as some jobs take a long time, be prepared to scale Zeebe horizontally.

number of workflow instances completed = function (broker load + flow complexity ). Same argument. If you are concerned about number of workflow instances that can be started, such as dealing with burst, again horizontal scaling of Zeebe is a good thing.

execution time per workflow instance to complete = function (broker load + complexity of workflow). If you want workflow instances to complete relatively quickly, then deploy your broker on beefy machines and ensure your jobs are not taking a long time. Also pay attention to variable sizes.

Summarizing notes for best practices:

  1. Keep workflow logic relatively straightforward and not very complex if possible.
  2. Always think about the size of workflow variables and strive to keep workflow variables relatively small. Large documents incur a serialization hit, not to mention storage space. Think of the performance hit during replication as well.
  3. Fetch only those variables needed in each workflow step. So leverage the fetchVariables API as in:

.client.newWorker().jobType(“some-type”).fetchVariables(“only,those,you,need”)

  1. Keep jobs relatively simple and ensure they return quickly, if possible. Small quick jobs, while apparently providing more chatter and create more events, allow for better areas of visibility and optimization and frees RocksDb from having to maintain many incomplete instances which also is a price to pay during replication.
  2. For broker hardware, use the beefiest machine you can afford. Including CPU and fast memory. CPU speed will allow Zeebe to do things quicker. Fast memory goes without saying, however, sufficient capacity will allow a broker to be able to save more state which means processing more workflow instances.
5 Likes

hi, @jwulf

  1. how to override Partition Limit by yaml file to avoid RESOURCE_EXHAUSTED Exception

  2. I now use docker-compose to deploy the cluster including es, operate. These docker services share a physical machine, which should be wrong.

Should the gateway and Brokers in the cluster be spread across different physical servers?
In addition, how to set ~2 threads per partition in the yaml file?

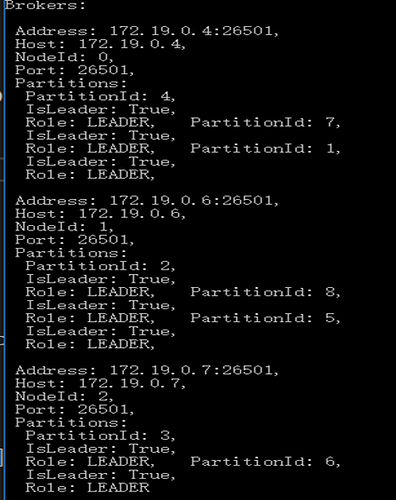
ps: this is my topology:

@Jango12345 what is your application trying to do? how are you configuration your application / Zeebe Client? Why did you added this question to this thread? It looks like a different problem altogether.

1 Like

Please do not ask new, unrelated questions in existing threads - make a new post.

 io.grpc.StatusRuntimeException: UNAVAILABLE: io exception

Your client cannot connect to the broker gateway. Either it is not started, the client has the wrong address configured, or the network is unreachable.

Please open a new thread if you require further assistance for this.

1 Like

I would like to jump into this RESOURCE_EXHAUSTED discussion. Currently I’m test-driving Zeebe 0.21.1 for a potential commercial usecase, and in my first 2 hours of testing it did not really make a good impression.

Here is what I did:

  1. fire up Zeebe using the docker compose method on a single node (my laptop)
  2. draw a simple BPMN looking like: start -> worker task -> message event -> worker task -> end
  3. create a Spring Boot+Camel microservice with REST endpoints to start workflow instance and to send a message with the Zeebe API, and test - all fine and working
  4. create 2 new REST endpoints to do both instance start and message correlation 1000 times in a row (on a single thread) - RESOURCE_EXHAUSTED

I really hope I had only hit some preconfigured soft limits in the engine, but could not find a way to reconfigure it yet. Is it possible to get rid of these limits?

What I expect is to load the Zeebe engine so my hardware becomes the bottleneck (I should see a high cpu load, memory getting filled up, etc.). How is it possible to reach this point?

ps. I can share my sample project if this helps understanding my scenario.

thanks much,
Kristof

2 Likes

Hi @kjozsa, welcome to the Zeebe community!

Happy to take a look at this. These cases are something that I am very interested in and collecting data on.

If you can share your project as a complete docker-compose it will be easy for me to run it, and if I can look at the source code then I can make an informed assessment.

best,
Josh

Hi Josh,

please find my code here: https://github.com/kjozsa/zeebe-hello

The BPMN used is in the root of the repo, after mvn package you can start the springboot app with :
$ java -jar target/zeebee-hello-0.0.1-SNAPSHOT.jar
$ curl localhost:5000/test/start/1000/0
$ curl localhost:5000/test/correlate/1000/0

and you’ll end up having the exception:

io.grpc.StatusRuntimeException: RESOURCE_EXHAUSTED: Reached maximum capacity of requests handled
at io.grpc.Status.asRuntimeException(Status.java:533) ~[grpc-api-1.24.0.jar!/:1.24.0]
at io.grpc.stub.ClientCalls$StreamObserverToCallListenerAdapter.onClose(ClientCalls.java:442) ~[grpc-stub-1.24.0.jar!/:1.24.0]

If docker-compose is easier for you, I packed it up now with docker and added the docker-compose file as you asked - you do need to edit the docker-compose.yml though adding the zeebe host you are using. This way you can do mvn package && docker-compose up to start it up and then use curl for the tests as above.

1 Like

Thanks!

Here is a GitHub issue to keep an eye on: https://github.com/zeebe-io/zeebe/issues/3137

I use the Node.js client. It has client-side retries for GRPC status 8, so this behaviour slows it down at times, but doesn’t result in fatal exceptions.

So this is an actual issue with backpressure misbehaving in the broker? Is it possible to turn backpressure off, or configure the backpressure queue parameters?

Are you as a dev actively looking into fixing this issue or is it someone else?

I’m asking mostly because we are in a phase of putting together the tech stack of a high-scale commercial solution and I was really hoping that Zeebe could qualify joining our stack. If we see no hopes of getting basic performance issues handled on a reasonable timeframe (weeks max) , we need to continue searching.

1 Like

Add a comment to the GitHub issue, or to this one: https://github.com/zeebe-io/zeebe/issues/3367.

Your reproducer is good, and will help engineering address this - assuming it still happens on the 0.22 alpha release.

Deepthi is the engineer who implemented back pressure and is working on it. See: https://zeebe.io/blog/2019/10/0.21-release/#backpressure. There is a link there to the PR that brought backpressure in, with a comment about configuration to turn it off.

I’m a Developer Advocate, so a lot of the time I’m taking user feedback to engineering (or directing users to the channels where they can do it directly).

To evaluate Zeebe (or any open source project), you want to evaluate the issue backlog (history), how fast things get addressed, how it is working with the engineers - do they take PRs, do they respond to issues, etc… (probable future), as well as the current state.

And you should probably test against 0.22.0-alpha.2 or the Docker SNAPSHOT tag, because 0.22 is very likely coming out in your time frame, and that release is more representative of the current state.

2 Likes

I tried it with Zeebe 0.22.0-alpha2 and did not see backpressure.

PR here: https://github.com/kjozsa/zeebe-hello/pull/1

Hmmmm… but I don’t get backpressure with the 0.21.1 image either. This is on my Macbook i9 with 32 GB of RAM.

What are you running it on?

1 Like

that’s a HP Zbook Studio G5, 8 x Intel® Core™ i7-7820HQ CPU @ 2.90GHz, 32Gb ram running Arch linux:
Linux manta 5.4.8-arch1-1 #1 SMP PREEMPT Sat, 04 Jan 2020 23:46:18 +0000 x86_64 GNU/Linux

btw thanks a lot Josh for your help, much appreciated!

1 Like

zeebe with kafka can improve performence?

1 Like

@walt-liuzw can you please elaborate? what performance?

eg:
under the same hardware/network/zeebe config conditions:
1.the producer sends batch messages and will not be rejected by brokers(RESOURCE_EXHAUSTED: Reached maximum capacity of requests handled)
2.consumers consume messages at higher rates and higher throughput

Can you tell me the advantages of zeebe + kafka?

If you increase your resources for the broker you will get more capacity. That’s the only way you will get more performance. That and working on your model to decrease the amount of work that the broker does.

You can also implement your own backpressure / buffering outside the broker using a queue. The Node client already has back-off retry in response to the RESOURCE_EXHAUSTED response from the broker.

You are not going to get more performance with either of those - you just stop the system from failing completely while it (hopefully) recovers.

1 Like