Questions about zeebe performance test

@Zelldon @jwulf hi guys
I have also consulted performance related issues before, this time I did a comprehensive test

1.Basic Information
(1) testing process:start->test task(type:test)->end
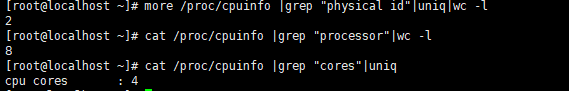
(2) zeebe server configuration: 4-core cpu 8G memory

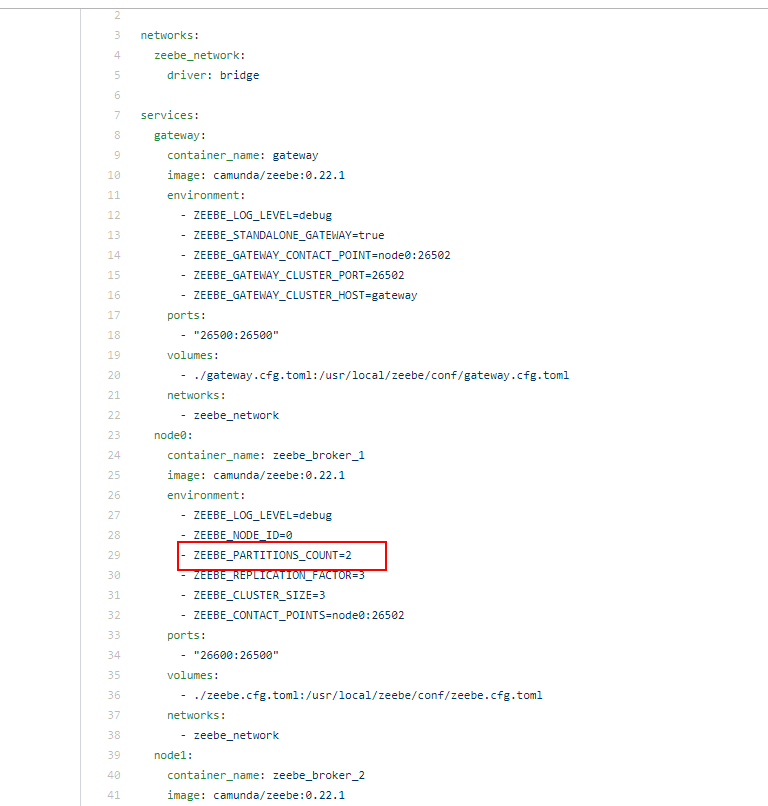
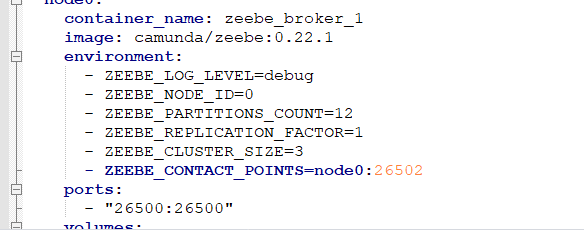
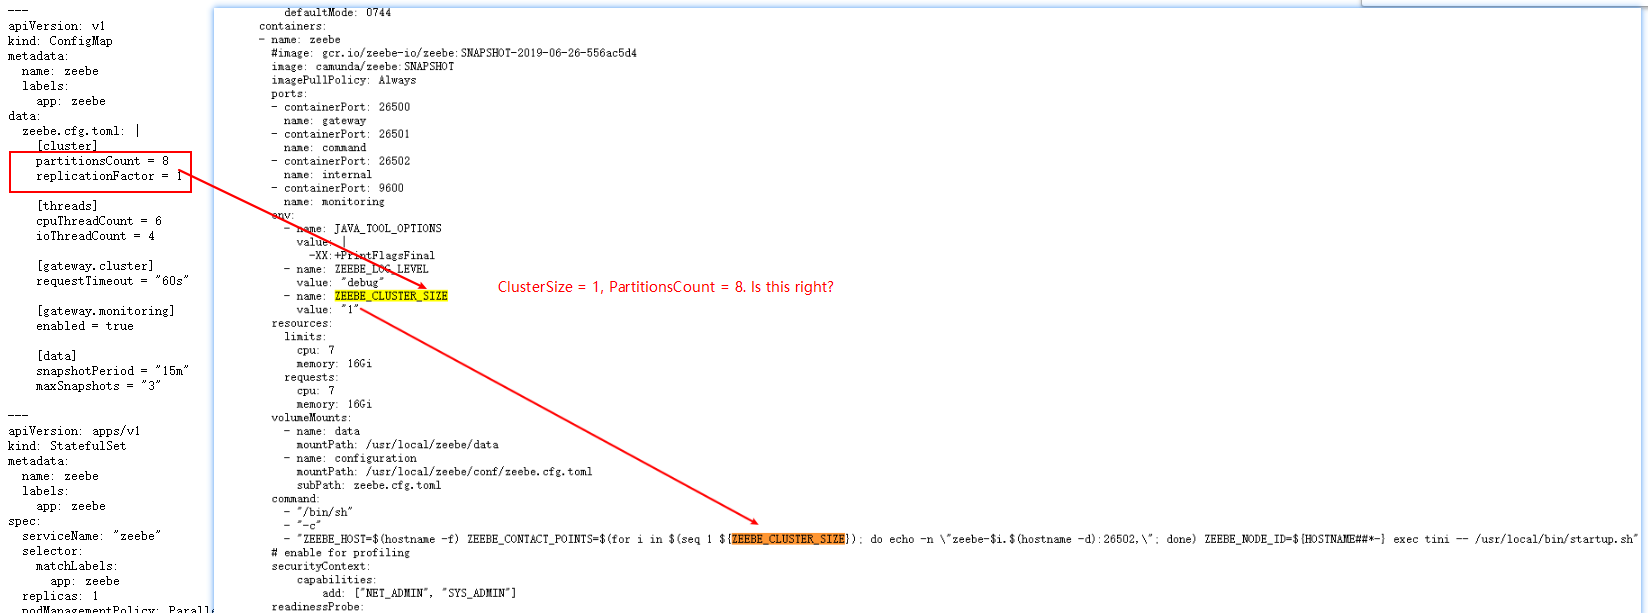
2.Use docker-compose to deploy files under the broker-only folder.
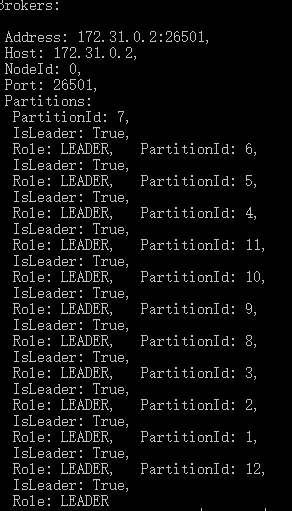
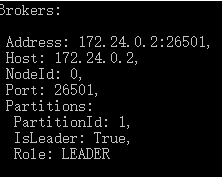
The topology result:
image

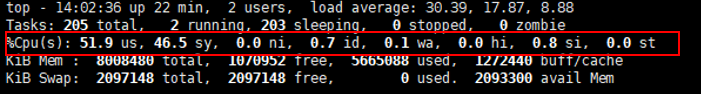
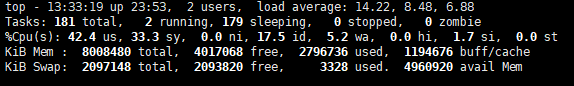
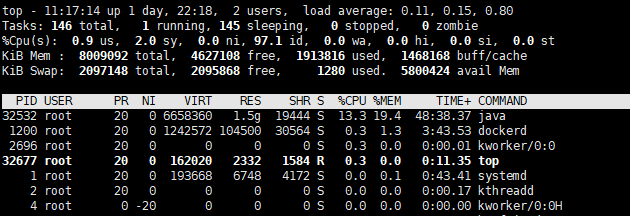
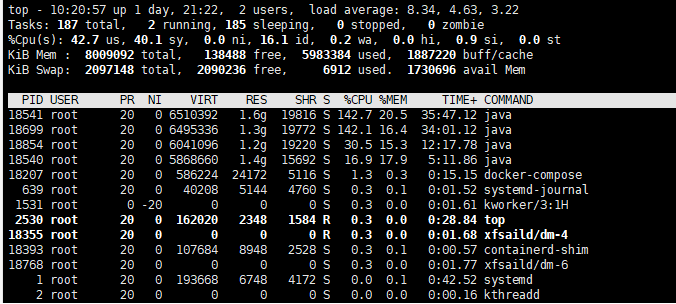
Use the command top to view server resource usage:
image

The microservice interface calls this test process by ZeebeClient:

var client = ZeebeClient.Builder().UseGatewayAddress(address).UsePlainText().Build(); var result = await client.NewCreateWorkflowInstanceCommand().BpmnProcessId("test-perf").LatestVersion().Send();
The JobWorker code:

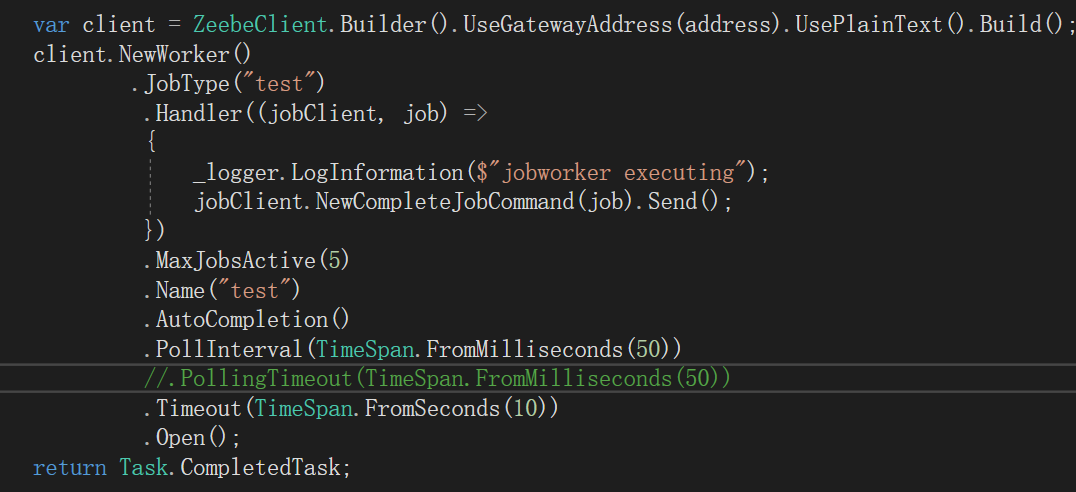
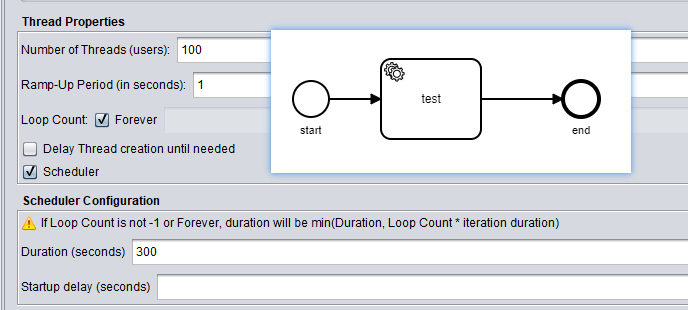
3.Testing with Jemter tools:
(1) 50 calls per second

(2) 100 calls per second
and modify the configuration items of the Jobworker: MaxJobActive由5变成15,PollInterval由50ms变成10ms

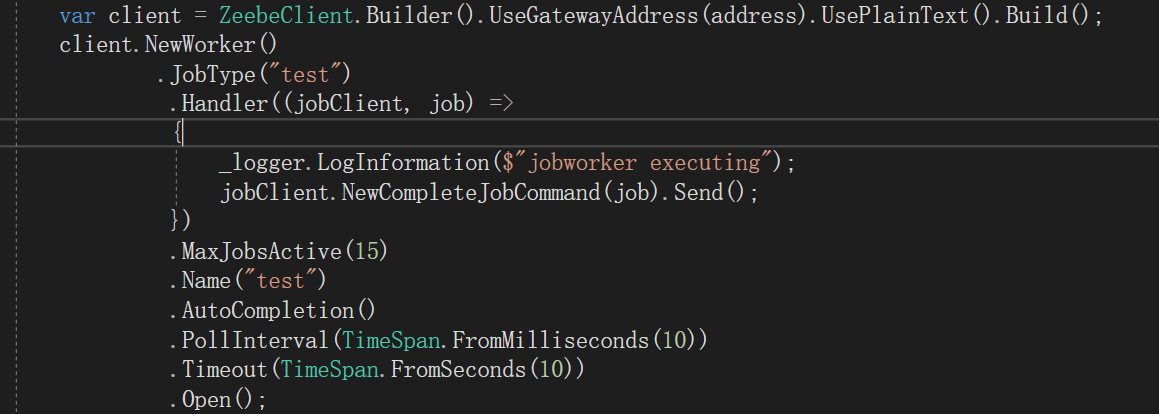
However, throughput has not improved. I started two JobWorkers, the code of both is exactly the same, they are two independent processes. Using 2 JobWorkers to consume messages, the effect remains the same.

4.Using multiple JobWorkers
I found that starting multiple JobWorkers did not improve throughput, so I redeployed the zeebe brokers on the server and used the standalone-gateway file to download the file.
After the deployment is completed, it is found that the server resources are increased.
image

Then repeat the above operation:
When called 50 times per second, Jmeter results show high error rate:19.62%, we cannot accept this error rate.

5. Use two processes, but the same type of ServiceTask
I create two process files using Zeebe Modeler:
BpmnId: test-perf, Start-> Task (type = test)-> End
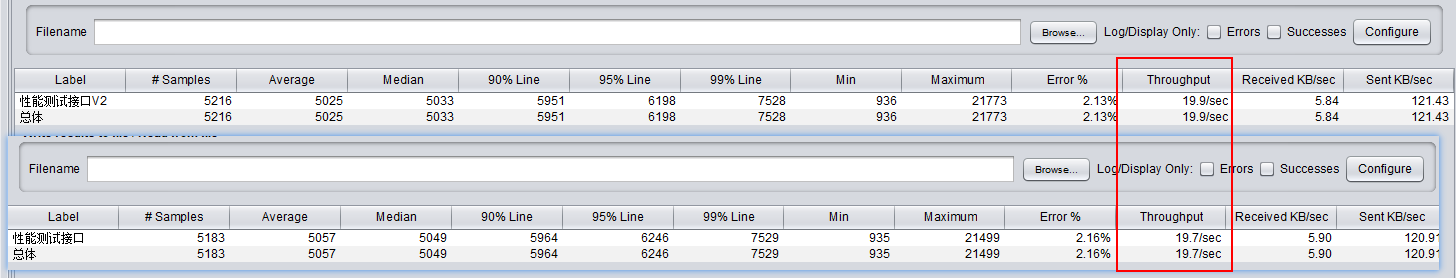
BpmnId: test-perf-v2, Start-> Task (type = test)-> End

These two processes were called using two microservice APIs, respectively, and eventually found that the threshold of throughput 40 was fixed, and the results of the two APIs were 20

After the above operations, I have a few questions:

  1. Is single node service better than cluster? Cluster is just distributed fault-tolerant?
  2. When I modify the configuration code of the JobWorker, I find that the throughput cannot be changed, that is, the modification of the JobWorker configuration cannot change the consumption speed? (Actually, I observed the consumption speed and found that there is a change. Using PollInterval = 50ms and PollInterval = 10ms, the consumption speed is different.)
  3. Why can’t I change the throughput by enabling multiple JobWorkers? Similar to MQ, if you increase the number of consumer services, you can increase throughput. Why can’t Zeebe?

At present, the concurrent support of a single node calls the microservice API 150 times per second. This result is acceptable. But the throughput is still too low.

1 Like

Hey @walt-liuzw,

thanks for the detailed report and reaching us out.

There are different things to increase performance (throughput).
As first could you please show your zeebe cfg?
Because performance depends on different parameters

  • How many partitions do you have?
  • How many threads/cpu assigned to the broker etc.
  • What kind of machine do you use?
  • Are you running in a cloud env or local?

I will try to shortly explain why you don’t see any improvement with more workers. If you have for example one partition ( which I assume) then this partition has a maximum throughput it can achieve. This is based on different properties. I mentioned some above.

If you add workers you just increase the consumers, but it might not be more to consume.
I will try to explain that with an analogy.

You can think of the broker as a post office. The partition is one guy which is working there. He has to validate the address, do the stamps etc. He has a maximum throughput. You then have a postman which takes the letters from the office and bring it to the end users. If you add more postman’s you will not increase the letters you can send, since you’re limited by the guy working in the office.

This means you can either put more workers in the office (increase the partitions) or you fire the old guy and hire a new guy which has more throughput (increase the resources, use better machine etc.). You can also do both.

Will having a cluster affect the throughput instead of having one broker ? Of course. If we use the same analogy again, then we have for example three guys working in the office. But only one does the work, the other just have to sign it that this is fine what the one is doing. The throughput will degrade, but if one of the guy is sick the others can take over, which is the benefit you have with a cluster. This again assumes one partition.

Hope this helps to understand it better.

Greets
Chris

1 Like

@Zelldon Thank you very much for your reply

My zeebe cfg file was git cloned from the master branch on GitHub - camunda-community-hub/zeebe-docker-compose: Zeebe with Operate Docker Compose configuration

Zeebe service for a single node uses zeebe-docker-compose/broker-only at master · camunda-community-hub/zeebe-docker-compose · GitHub

Zeebe Cluster services use zeebe-docker-compose/standalone-gateway at master · camunda-community-hub/zeebe-docker-compose · GitHub

  • How many partitions do you have?

broker-only has partitions =1
standalone-gateway cluster have partitions =2

  • How many threads/cpu assigned to the broker etc.

broker-only has threads/cpu
gateway.threads:managementThreads = 1
threads:cpuThreadCount = 2 ioThreadCount = 2

standalone-gateway cluster have threads/cpu :
threads:managementThreads = 1,

  • What kind of machine do you use?

zeebe use OS: centos7, 4-core cpu and 8G Mem

  • Are you running in a cloud env or local?

company test linux server

Hey @walt-liuzw,

thanks for your response and provided information.
What type of disk you’re using? It might be that your IO is already saturated.
As I mentioned I would try to increase the partition count and if possible put it on a bigger machine.
Also not 100% how or what you exactly measure. Do you measure how many jobs you’re complete in the worker or how many instances in the end are completed? This is also a difference.

What is the throughput you want to reach?

Greets
Chris

disk using Mechanical hard disk

I did two tests, the first one was using broker-only; the second one was using standalone-gateway, and the second was to include multiple Partitions, as can be seen from the zeebe cfg configuration file: each broker contains 2 Partitions. The second result is inferior to the first

I want each JobType(whether consumed by several BpmnId processes) in JobWorker to reach 100/s.

I also found a problem in the test: I have a JobHander C# code:

client.NewWorker().JobType("test").Handler((jobClient, job) => {
     _logger.LogInformation("jobworker executing");
     jobClient.NewCompleteJobCommand(job).Send();
 }) .MaxJobsActive(50)
   .Name("test")
   .AutoCompletion()
   .PollInterval(TimeSpan.FromMilliseconds(5))
   .PollingTimeout(TimeSpan.FromMilliseconds(50))
   .Timeout(TimeSpan.FromSeconds(10))
   .Open();

If two BpmnId processes consume one JobType at the same time, the throughput is divided equally (throughput value / 2). I guess if there are n BpmnId processes that consume the same JobType, then the throughput of each process = the throughput of a single process / n, why not isolate between processes?

PS: ~ 2 threads per partition by Zeebe | Camunda 8 Docs
How to set the number of partitions of a standalone gateway cluster?
Is Partitions count = cpu core count * 2?

thanks

disk using Mechanical hard disk

I would encourage you to use SSD’s instead. The broker does a lot of IO operations and might be limited by the hard disk.

I did two tests, the first one was using broker-only; the second one was using standalone-gateway, and the second was to include multiple Partitions, as can be seen from the zeebe cfg configuration file: each broker contains 2 Partitions. The second result is inferior to the first

You changed several parameters at once. In this type of tests you should normally do it step by step, which means change one parameter at a time. Otherwise you don’t know which parameter had the effect.

When called 50 times per second, Jmeter results show high error rate: 19.62% , we cannot accept this error rate.

What does this even mean? What kind of error do you see there?

I want each JobType(whether consumed by several BpmnId processes) in JobWorker to reach 100/s.

Not sure whether this is the right metric, because what if you create new instances which don’t contain this type or introducing new complexity. What I can say is that each partition is limited by X. X is the number of events the partition can read and process in a second. These events can be everything, from start events to end events, so in between there could be timers, messages, tasks, gateways etc. Literally everything in the bpmn model needs to be processed. If you have a worker you just see the task he was able to activate and can complete, but the underlying processes can be endless complex.

Are the processes always straight forward? If you do these kind of tests and see in the end your expected throughput in the jobs workers, you have to keep in mind that this can change significantly when you change/extend the model. Or deploy new models for other scenarios.

If two BpmnId processes consume one JobType at the same time, the throughput is divided equally ( throughput value / 2 ). I guess if there are n BpmnId processes that consume the same JobType, then the throughput of each process = the throughput of a single process / n , why not isolate between processes?

This is again expected. Think of the post office example. You have multiple senders which want to send a letter to the same address, but only one postman, where his bag is limited. What would you expect?
The worker in the office works on his limit, and only manages to do 40 letters in a second.

client.NewWorker().JobType(“test”).Handler((jobClient, job) => {
_logger.LogInformation(“jobworker executing”);
jobClient.NewCompleteJobCommand(job).Send();
}) .MaxJobsActive(50)
.Name(“test”)
.AutoCompletion()
.PollInterval(TimeSpan.FromMilliseconds(5))
.PollingTimeout(TimeSpan.FromMilliseconds(50))
.Timeout(TimeSpan.FromSeconds(10))
.Open();

BTW you don’t need to complete the job if you using the auto completion feature.

PS: ~ 2 threads per partition by Zeebe | Camunda 8 Docs
How to set the number of partitions of a standalone gateway cluster?
Is Partitions count = cpu core count * 2?

Thanks for pointing this out. I think we have to update this. The cpu thread is used by the processor and the io thread is used by the exporter. Do you use an exporter by the way?

Side note: If you want to benchmark the system it often helps me to take a look in the metrics how the system behaves. The Zeebe Broker export the prometheus metrics via endpoint. Take a look at this Zeebe | Camunda 8 Docs

Greets
Chris

thanks for reply @Zelldon

these errors are

The question I want to express is
Scenario 1: Start-> Create Order-> End
Scenario 2: Start-> Generate Order-> End
In the two scenarios above, Create Order and Generate Order call the same JobHandler. If I only monitor scenario 1, the throughput is throughput1 = 40; now I monitor two processes: scenario 1 and scenario 2, then throughput1 = throughput2 = 20

This example is very good and I can easily understand it. Your suggestion is that increasing the number of Partitions will increase The worker in the office works on his limit, but I have modified the cfg configuration:
image
Partitions count changed from 2 to 12. My virtual machine server has been upgraded from 4 cores to 8 cores (the number of cores here refers to the processor count of the virtual machine)

image

Using 8-processor and 12 Partitions servers, the final throughput result is:40.9/sec
This makes me always feel that there is a parameter to keep the throughput value around 40. I find that the CPU utilization of my server is as follows:(idle percent=0.7%)

I will add later, these experiments are now without Exporter

Prometheus can help me see where the performance bottlenecks are. Now I just simulate the simplest scenario: start-> empty task-> end, run on the server I usually configure, and its throughput makes me not optimistic.

BPM helps me solve the problem of tight coupling between microservice interfaces, but if we have more business presser, we will consider more about performance and the cost of purchasing a high-profile server

best wishes

@walt-liuzw in addition to the awesome analogies above, you may want to read up on several Zeebe performance articles including a good summary here:

2 Likes

@klaus.nji thanks for your reply.

I have read this blog, which introduces and gives the configuration of k8s and the configuration of the server.

First, my zeebe service is deployed on a linux machine, so I use docker-compose
Then, I used the yml files of GitHub - camunda-community-hub/zeebe-docker-compose: Zeebe with Operate Docker Compose configuration given on the official website, and found that the performance results were not satisfactory
In the end, according to the suggestions you provided, “Increase the number of Partitions to increase throughput”, I finally found that the number of Partitions may not be the only condition to improve throughput.

BTW:
https://zeebe.io/code/blog/zeebe-horizontal-scalability/zeebe.yaml

Now I follow this configuration and modify the zeebe cfg file(my virtual machine server 8-processor, 8GMem, 20G ordinary mechanical hard disk):

 environment:
      - ZEEBE_LOG_LEVEL=debug
      - ZEEBE_PARTITIONS_COUNT=8

[gateway.threads]
managementThreads = 2

[threads]
cpuThreadCount = 6
ioThreadCount = 2


Use Jmeter to call API, 100 times/s
image

Monitoring the CPU usage of the server, it was found that the idle ratio was about 17.5%, and the memory was about 4G.
image

But the end result is as follows:


The throughput is finally around 40,
When the configuration file is configured as follows:

  environment:
       -ZEEBE_LOG_LEVEL = debug
       -ZEEBE_PARTITIONS_COUNT = 1

[gateway.threads]
managementThreads = 1

[threads]
cpuThreadCount = 2
ioThreadCount = 2

There is no essential difference. The zeebe broker occasionally throws exceptions:

2020-02-25 05: 49: 18.995 [GatewayLongPollingJobHandler] [Broker-0-zb-actors-0] WARN io.zeebe.gateway-Failed to complete BrokerActivateJobsRequest {requestDto = {"type": "test", "worker" : "test", "timeout": 10000, "maxJobsToActivate": 2, "jobKeys": [], "jobs": [], "variables": [], "truncated": false}}
zeebe_broker | io.grpc.StatusRuntimeException: CANCELLED: call already cancelled
zeebe_broker | at io.grpc.Status.asRuntimeException (Status.java:524) ~ [grpc-api-1.26.0.jar: 1.26.0]
zeebe_broker | at io.grpc.stub.ServerCalls $ ServerCallStreamObserverImpl.onCompleted (ServerCalls.java:368) ~ [grpc-stub-1.26.0.jar: 1.26.0]
zeebe_broker | at io.zeebe.gateway.impl.job.LongPollingActivateJobsRequest.complete (LongPollingActivateJobsRequest.java:73) ~ [zeebe-gateway-0.22.1.jar: 0.22.1]
zeebe_broker | at io.zeebe.util.sched.ActorJob.invoke (ActorJob.java:73) [zeebe-util-0.22.1.jar: 0.22.1]
zeebe_broker | at io.zeebe.util.sched.ActorJob.execute (ActorJob.java:39) [zeebe-util-0.22.1.jar: 0.22.1]
zeebe_broker | at io.zeebe.util.sched.ActorTask.execute (ActorTask.java:115) [zeebe-util-0.22.1.jar: 0.22.1]
zeebe_broker | at io.zeebe.util.sched.ActorThread.executeCurrentTask (ActorThread.java:107) [zeebe-util-0.22.1.jar: 0.22.1]
zeebe_broker | at io.zeebe.util.sched.ActorThread.doWork (ActorThread.java:91) [zeebe-util-0.22.1.jar: 0.22.1]
zeebe_broker | at io.zeebe.util.sched.ActorThread.run (ActorThread.java:195) [zeebe-util-0.22.1.jar: 0.22.1]

JobWorker is implemented using the net console app, the code is as follows:

var client = ZeebeClient.Builder().UseGatewayAddress(address).UsePlainText().Build();
            client.NewWorker()
                    .JobType("test")
                     .Handler((jobClient, job) =>
                     {
                         _logger.LogInformation($"jobworker executing");
                         //jobClient.NewCompleteJobCommand(job).Send();
                     })
                     .MaxJobsActive(10)
                     .Name("test")
                     .AutoCompletion()
                     .PollInterval(TimeSpan.FromMilliseconds(10))
                     .PollingTimeout(TimeSpan.FromMilliseconds(50))
                     .Timeout(TimeSpan.FromSeconds(10))
                     .Open();

best wishes

Hey @walt-liuzw,

the errors you’re posted are thrown if you reach the limit of the broker, so called back pressure.

In the two scenarios above, Create Order and Generate Order call the same JobHandler. If I only monitor scenario 1, the throughput is throughput1 = 40 ; now I monitor two processes: scenario 1 and scenario 2, then throughput1 = throughput2 = 20

With monitoring you probably you mean you start workflow instances? How does this btw look like? Maybe you are not starting enough instances per second?

Using 8-processor and 12 Partitions servers, the final throughput result is:40.9/sec
This makes me always feel that there is a parameter to keep the throughput value around 40. I find that the CPU utilization of my server is as follows:(idle percent=0.7%)

You should not over commit your broker. If you have 8 cores then I think you should at max use 8 partitions. BTW you also need to increase the cpuThread count in the config respectively.

I have still the feeling that your disk is the bottleneck. Could you somehow check the IO saturation via a linux tool? Or if possible switch to a SSD and see what this changes.

and its throughput makes me not optimistic.

I understand that, but still there a lot of parameters you can try out.

My suggestion would be the following. Try to setup a three node cluster, with 3 partitions, replication factor 3 and check how that changes your throughput. With that you should see a different throughput, even if you use hard disks. The reason for that is each node will be leader for one partition and you can share the work. If you don’t want to have replication you can set the replication factor to one. The best would be to use SSD then this will also increase the performance as I wrote before.

Example config for each node:

[cluster]
partitionsCount = 3
replicationFactor = 3
clusterSize = 3

[threads]
cpuThreadCount = 4
ioThreadCount = 4

Or you use these env variables, but then you still need to change the cpu counts

      ZEEBE_PARTITIONS_COUNT:    3
      ZEEBE_CLUSTER_SIZE:        3
      ZEEBE_REPLICATION_FACTOR:  3

Greets
Chris