Hello,
I’am using Prometheus server to collect metrics from our 3 nodes Zeebe(0.21.1) cluster. Provided metrics are cool for checking the cluster performance, but i was not be able find metrics that help me to detect and alerts me if the cluster/node is down for a reason or another.
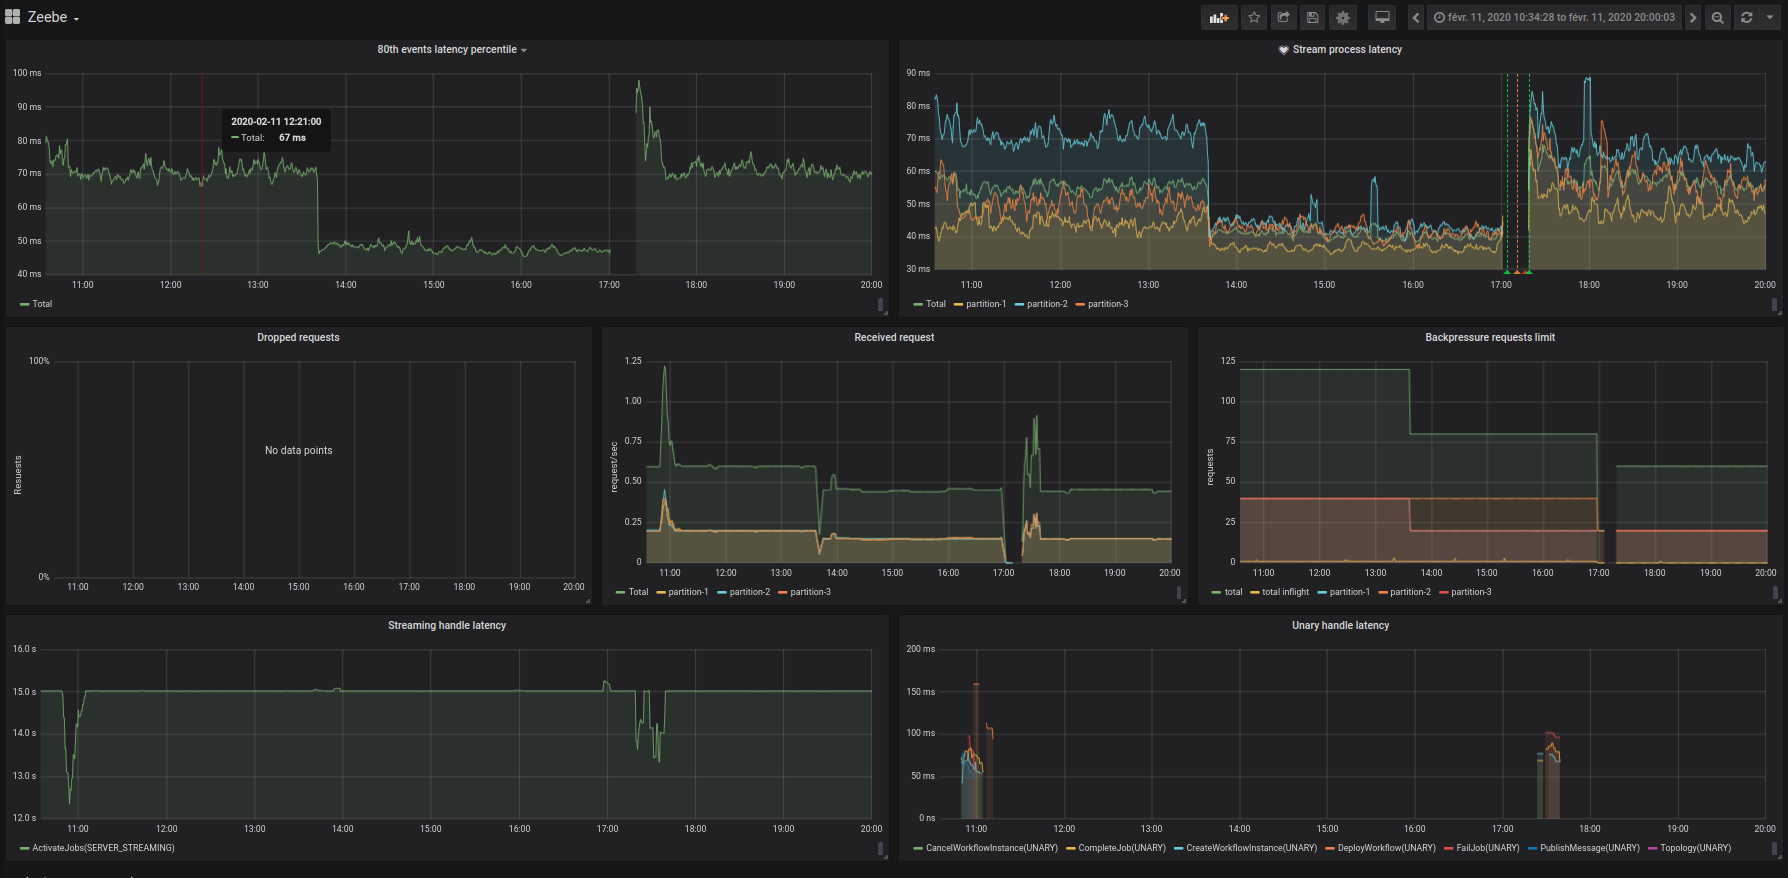
I tried to use the absence of metrics as a signal of a cluster failure, but that didn’t work for me. Yesterday, my clients kept receiving GRPC::Unavailable for 3 hours till someone noticed that and alerted me. Bellow some metrics i use, cluster failed at 13:40 and fixed at 17:20 by removing the data/raft-atomix on every node and restarting them (this is not our topic ).
Edit: oh, I just saw that you gave it a shout-out.
The only reliable way to tell that it is down is the absence of work that you expect.
With an end-to-end test it proves that all layers in your system are alive. Otherwise you have to introduce checks for each component - cluster, workers, worker to cluster - and then how do you know that the cluster is not up but not doing anything (ie: no processes are being processed).
The canary / heartbeat approach proves all of those at once.
If you don’t want to use healthchecks.io, you could make the healthcheck a Prometheus endpoint in a worker and alert on that.
@RedUno thanks for the question and the feedback… are you using the Helm Charts? Are you using the Prometheus Operator provided in there?
I know that we have some custom dashboards from Zeebe that I was planning to integrate, but I am super interested to see how people is using it.
Maybe we can come up with a community dashboard + alerts that we can embed in the Helm charts.
Yes, it’s clear that the zeebe cloud canary is more reliable when proving that the system is actually doing the job. I was trying to find a solution that don’t need an additional layer which could be another potential failure point to the system.
Well, as cloud canary is the best choice actually, i will try to integrate it to our architecture, by making the cloud canary a prometheus endpoint as you suggest, or making the worker push heartbeat directly to our prometheus server https://prometheus.io/docs/practices/pushing/. I prefer the first one.
Hi @salaboy,
no we are using a customs Helm charts, not the one provided by you since we started using Zeebe before the chart was created (June 2019). But i think they are quite similar, we are using Prometheus Operator too.
@RedUno if you see differences between the charts and you have the time to contribute to the ones that are provided in helm.zeebe.io let us know… we would love to improve those charts so you don’t need to maintain yours.