@philipp.ossler, thank you for prompt response.
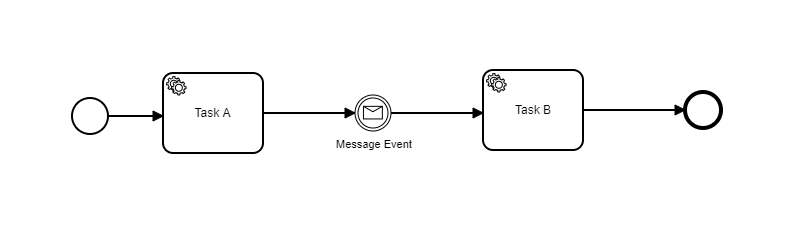
The workflow is like
Commands executed in order
Task A - after task logic client.newCompleteCommand(job.getKey()).variables(payload).send().join();
the workflow entered into the Intermediate Catch Event but subscription is not made at times (intermittent failure)
Task A - (exposed API)
this.zeebeClient.newPublishMessageCommand().messageName(messageName).correlationKey(corelationKey).timeToLive(Duration.ofMinutes((long)timeToLive)).variables(variables).send().join();
Time to live is 1 min
New finding today
The message subscription got created but after 2 hours of the Task A completion, I can see the event for subscription now with timestamp showing two hours later.
I’ve checked few more cases where the message subcription is getting delayed by 20-60 mins, is it expected? at times we have also seen the exception on broker
io.grpc.StatusRuntimeException: CANCELLED: call already cancelled
We have also observed some message subscription got generated only after broker restart which was done after 4 days of workflow submission
Zeebe version
zeebe-util-0.22.0-alpha1.jar:0.22.0-alpha1
Exported events
Message Published (This happens after task A has completed and there is some user activity involved which triggers message publish event (usually takes 5 mins time after task A completes))
“_index” : “zeebe-record-message_2020-01-13”,
“_type” : “_doc”,
“_id” : “2-16561397058096”,
“_score” : 2.3025851,
“_source” : {
“partitionId” : 2,
“value” : {
“timeToLive” : 60000,
“variables” : {},
“correlationKey” : “6DBC1F29EA6443FB8CC5EF641B7467DD”,
“messageId” : “”,
“name” : “CMTK_Validation_Message”
},
“sourceRecordPosition” : 16561397057368,
“position” : 16561397058096,
“timestamp” : 1578906438486,
“valueType” : “MESSAGE”,
“intent” : “PUBLISHED”,
“recordType” : “EVENT”,
“rejectionType” : “NULL_VAL”,
“rejectionReason” : “”,
“key” : 4503599650233676
Message Deleted Event (after almost 1 min as per TTL)
“_index” : “zeebe-record-message_2020-01-13”,
“_type” : “_doc”,
“_id” : “2-16561397119200”,
“_score” : 2.3025851,
“_source” : {
“partitionId” : 2,
“value” : {
“timeToLive” : 60000,
“variables” : {},
“correlationKey” : “6DBC1F29EA6443FB8CC5EF641B7467DD”,
“messageId” : “”,
“name” : “CMTK_Validation_Message”
},
“sourceRecordPosition” : 16561397118456,
“position” : 16561397119200,
“timestamp” : 1578906516626,
“valueType” : “MESSAGE”,
“intent” : “DELETED”,
“recordType” : “EVENT”,
“rejectionType” : “NULL_VAL”,
“rejectionReason” : “”,
“key” : 4503599650233676