We think the restarts were caused by kubernetes deleting the pods because of memory usage (4gib limit), and on restart it was suffering the issue above, causing the system to be for all purposes down. This as been reported in zeebe slack channel earlier.
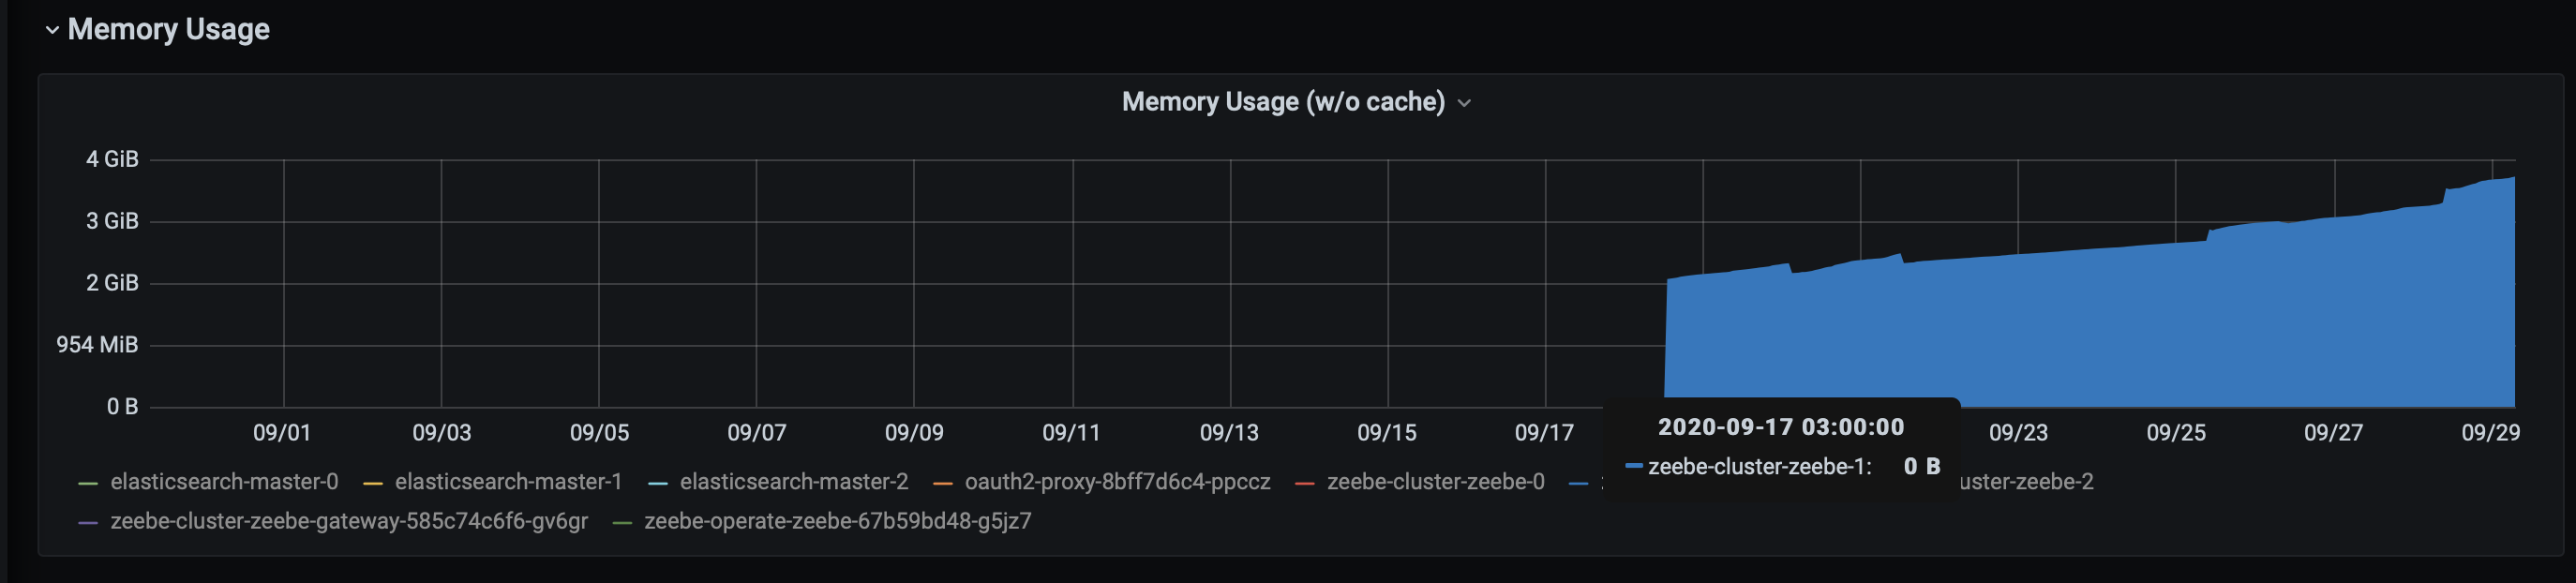
With 0.24.3, we saw restarts being quick, but we don’t necessarily know how the system will respond once the pods get restarted by kubernetes - which they will be soon due to memory usage. Here is the grafana output for one of the brokers:
I realise the original post was a little bit difficult to interpret - what was the question posed?
The tl;dr was that we have suffered the issue where brokers wouldn’t come online after being restarted, which was reported fixed in 24.3. Even after 24.3 we noticed the memory usage usage for the brokers was always climbing, and feared that once the broker was deleted due to resource policies, the same issue would occur.
So - what have we observed:
Deleted the main broker (broker-1, the one with highest resource usage) instead of waiting for Kubernetes to kill the pod. This to ensure we could watch the restart. The really, really REALLY great news is that the broker was back up in less than a minute and there was no downtime.
While there is certainly a less than desirable memory usage, the fact that the system can restore itself quickly means the impact is neglible.
Thanks Chris - looks relevant, but hard to say for a layman . We don’t have long running workflows, they will typically run from start to finish in a few seconds. Looks like the issues are not resolved or currently worked on - are there any plans to reopen? From my point of view that would be very desirable. Should we potentially adjust memory limits in kubernetes to restart pods earlier than 4gib? I mean to avoid performance degradation when memory usages gets very high.
Restartet one of the brokers today, to see if we could get better resource usage.
We had profiles like this for all brokers:
zeebe zeebe-cluster-zeebe-1 73m 3928Mi
Now the restartet broker (0) is has been starting for over 2 hours, looking alot like the issue we had prior to 24.3 (we believed it fixed by https://github.com/zeebe-io/zeebe/issues/5135)
However… after that one restart which took 11 minutes, restarting the broker again was pretty much less than a minute, and restarting the other two took only a few minutes as well. So it was almost like the initial restart “cleared up” alot …
Would be interesting if you could check the file count in the snapshots of all Brokers. You mentioned you have three Brokers, but how many partitions do you have?
 . We don’t have long running workflows, they will typically run from start to finish in a few seconds. Looks like the issues are not resolved or currently worked on - are there any plans to reopen? From my point of view that would be very desirable. Should we potentially adjust memory limits in kubernetes to restart pods earlier than 4gib? I mean to avoid performance degradation when memory usages gets very high.